Track your performance
Finglass uses R2 score as the primary metric to score predictions.
Each Finglass Lab Contributor has multiple options for validating their model’s performance:
- Cross-validation within the training dataset.
- Access the
confidence_scoreafter submitting predictions via Finglass Lab SDK. This score is measured on a validation portion of the submitted predictions. Predictions above a certain R2 threshold will be accepted and considered for payouts calculation. - Final validation on realized data: predictions submitted to Finglass Lab are forecasting the future financial indicators for thousands of public companies. When these companies release their future financial reports, Finglass compares the predicted indicators with realized values and calculates the actual R2 score. Based on this score Contributors are awarded USD compensation on a monthly basis.
Finglass Lab also provides an interactive dashboard for each contributor where one can track different performance metrics.
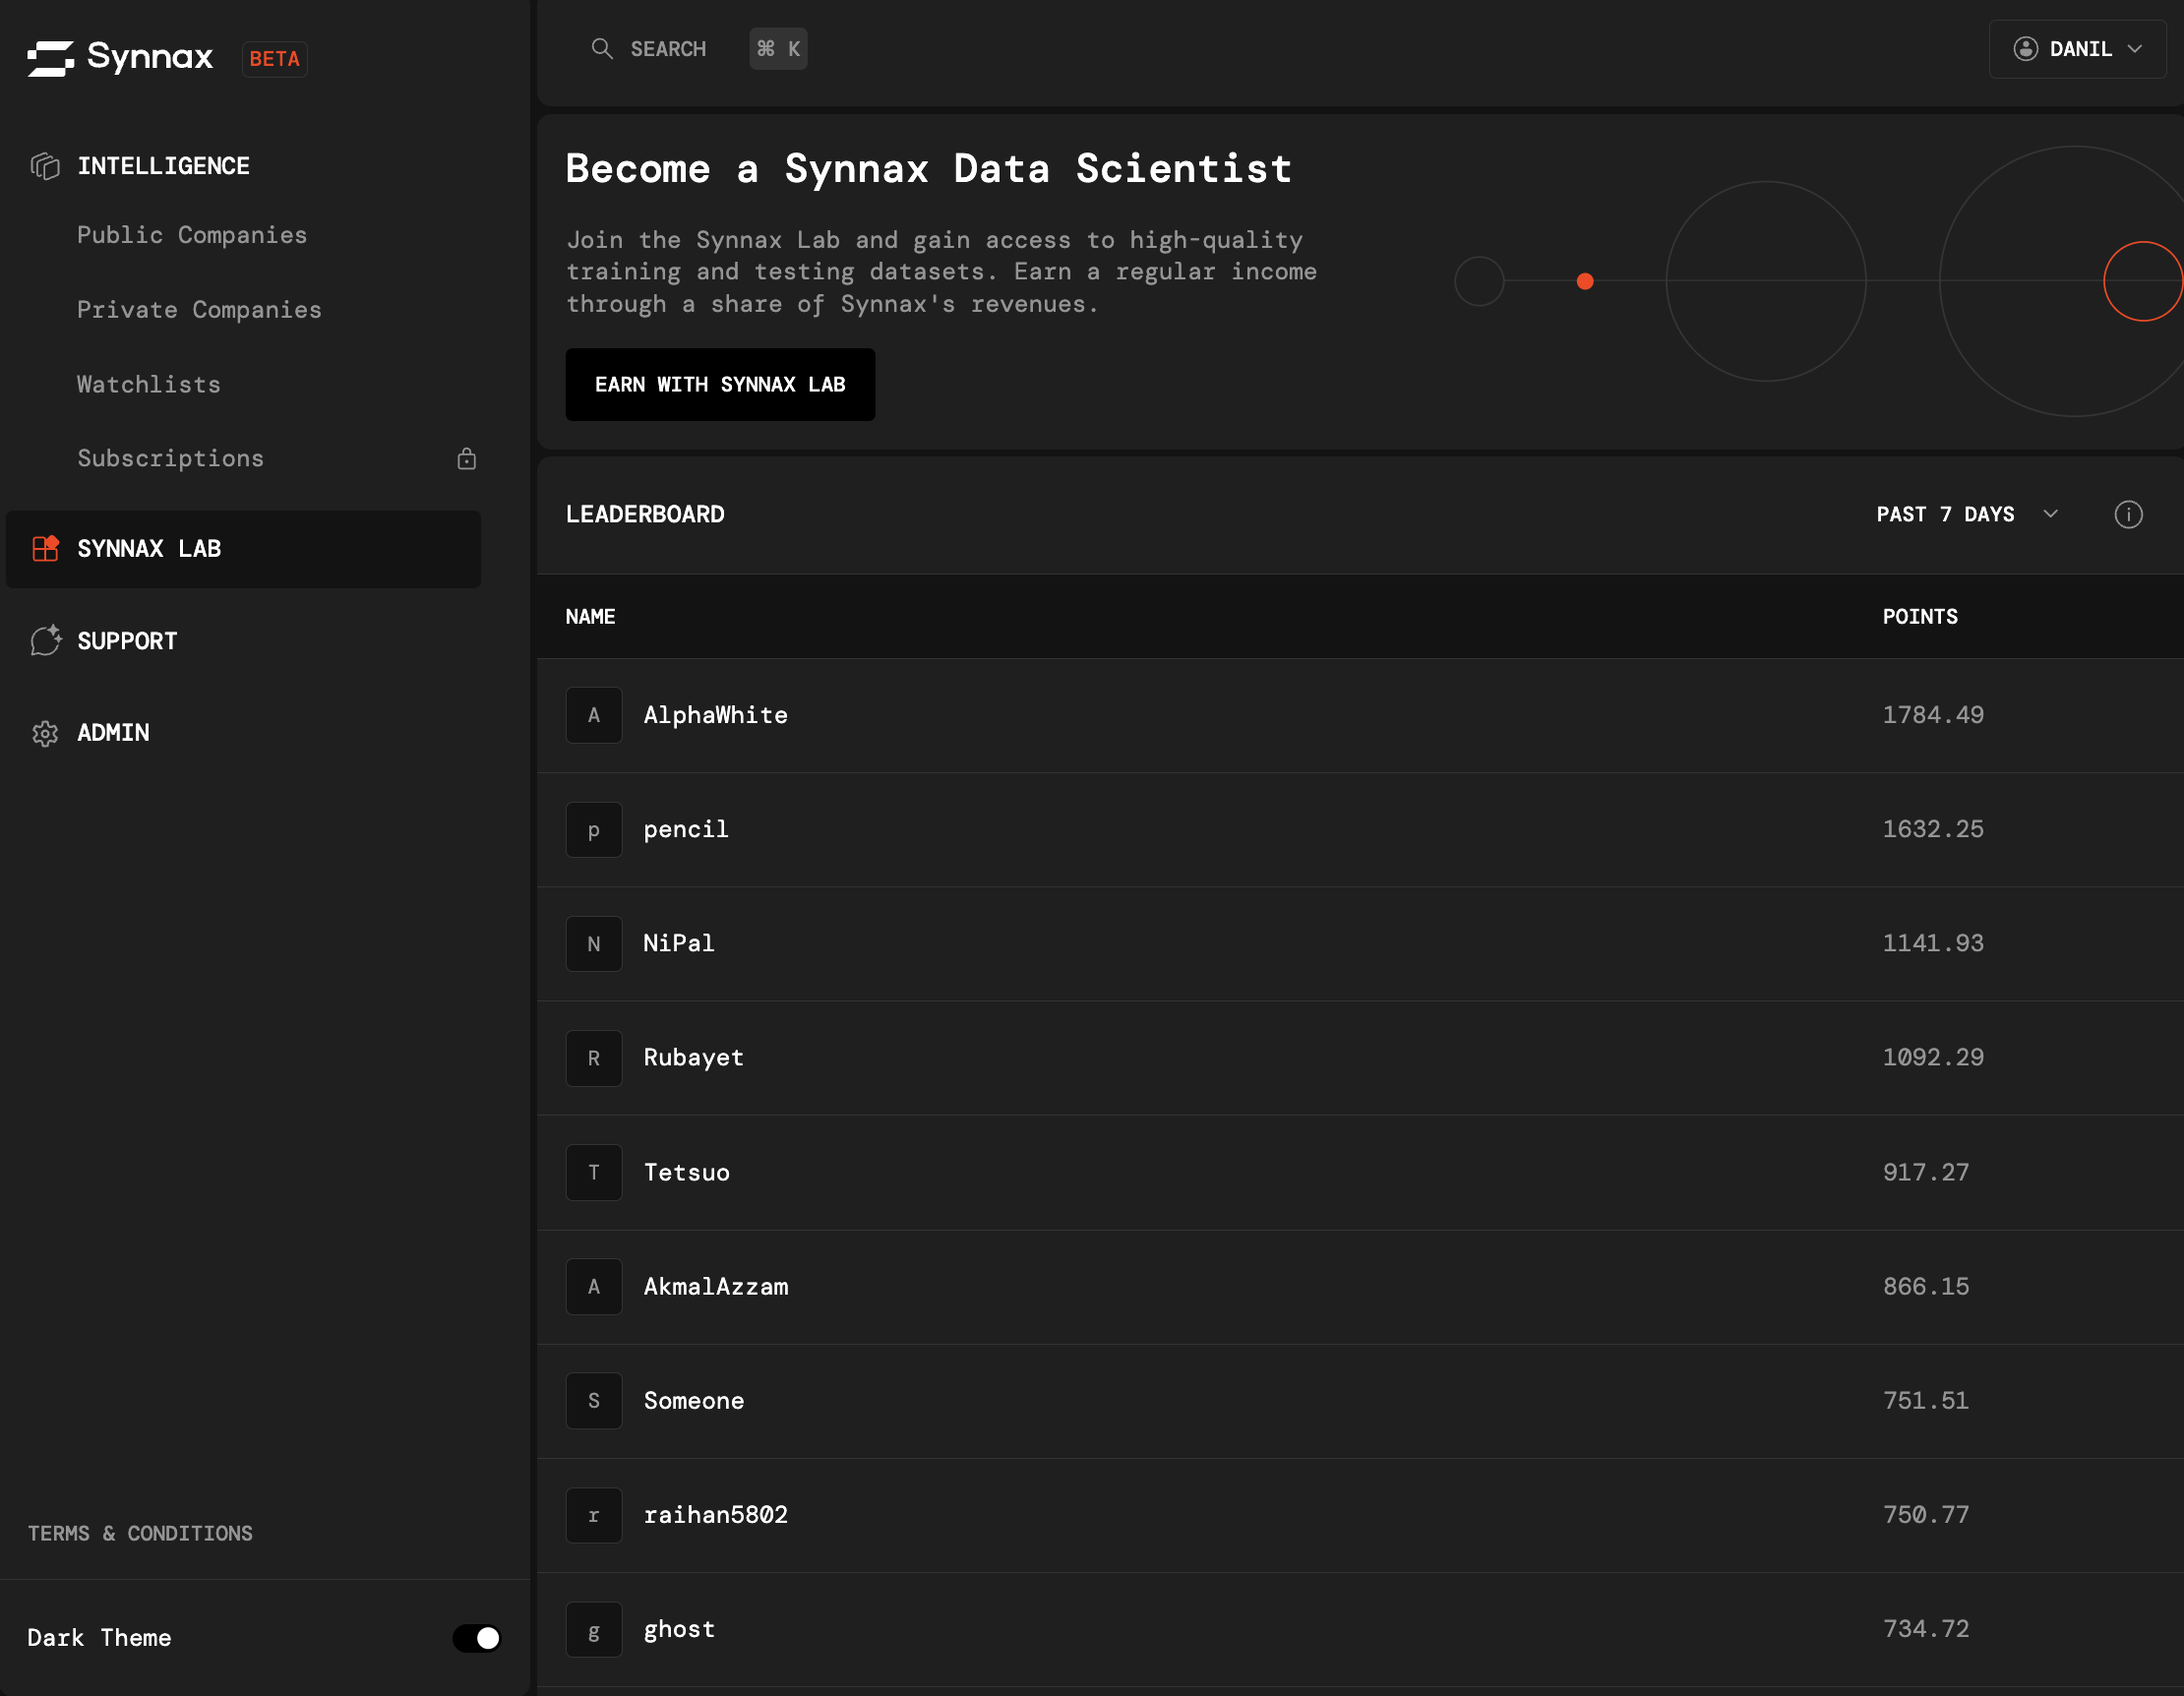
Leaderboard
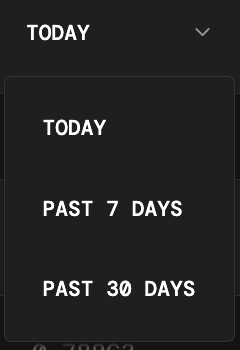
Scoring timeframe options
By selecting Today, Contributors will see the R2 score of their best submission today based on a randomly selected portion of the test set. Past 7/30 days option will show points accumulated over the respective period.
Individual performance view
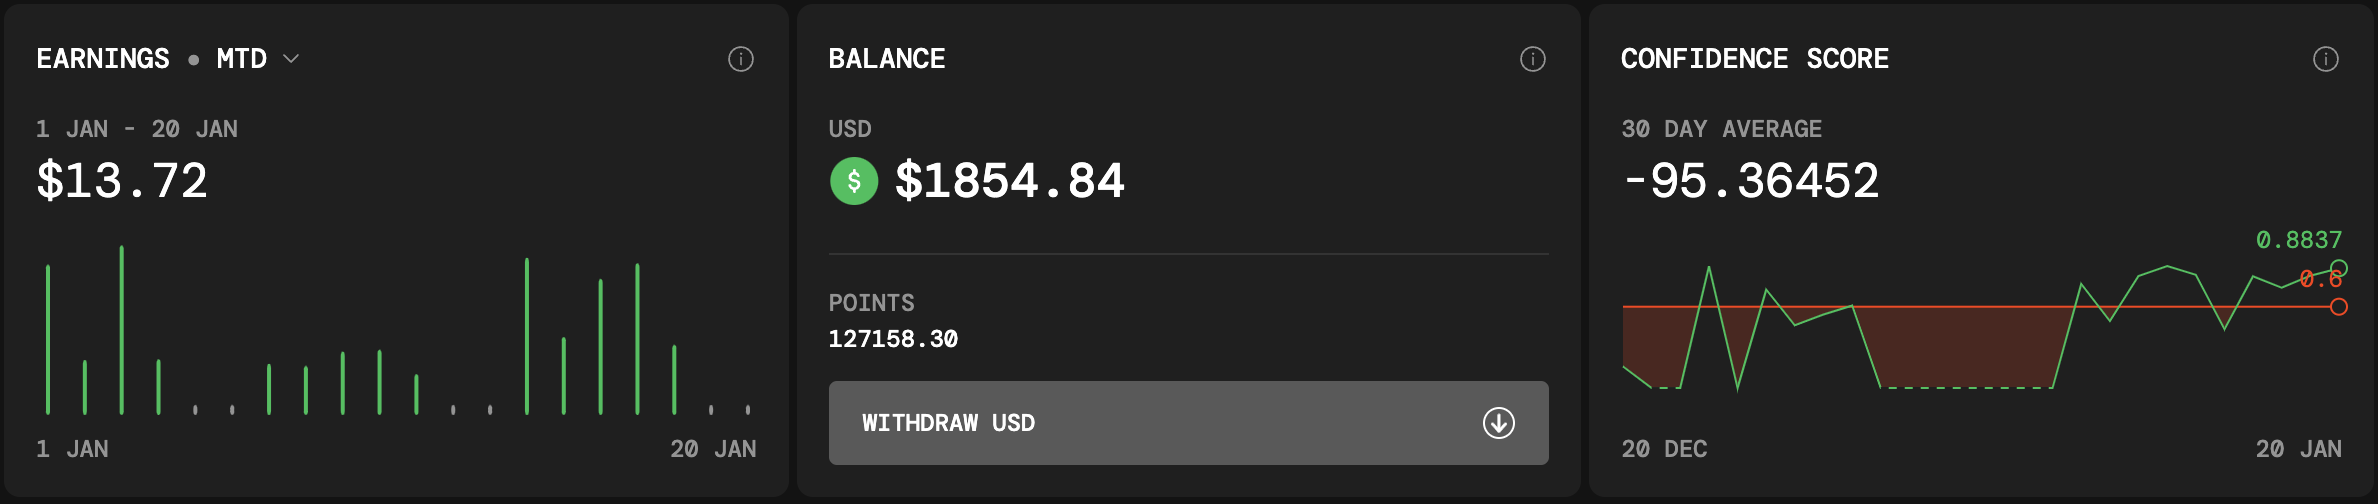
Above the leaderboard are the individual Contributor’s performance indicators.
- Earnings: month-to-date / last month / year-to-date / last year
- Balance: your current accumulated balance available for withdrawal
- Confidence score chart: past 30 days of best submissions’ R2 scores with a required minimum threshold horizontal line. Predictions below the threshold had not been considered for entering the Finglass Lab rating and are not subject to earnings calculation.